Info
This is now my project for the Sanger Mentorship Program 2024 where I’ll have two mentees to work with me on getting it closer to completion.
There’s no point in writing pipelines to help save biodiversity and the planet, if by running the pipeline we pollute it far bey ond necessary. This is the aim of SummaryStats, to take a file output from previous runs of the pipeline, parse with machine learning and use this to generate optimised resource algorithms for future runs of the pipeline.
The structure of this process is as such:
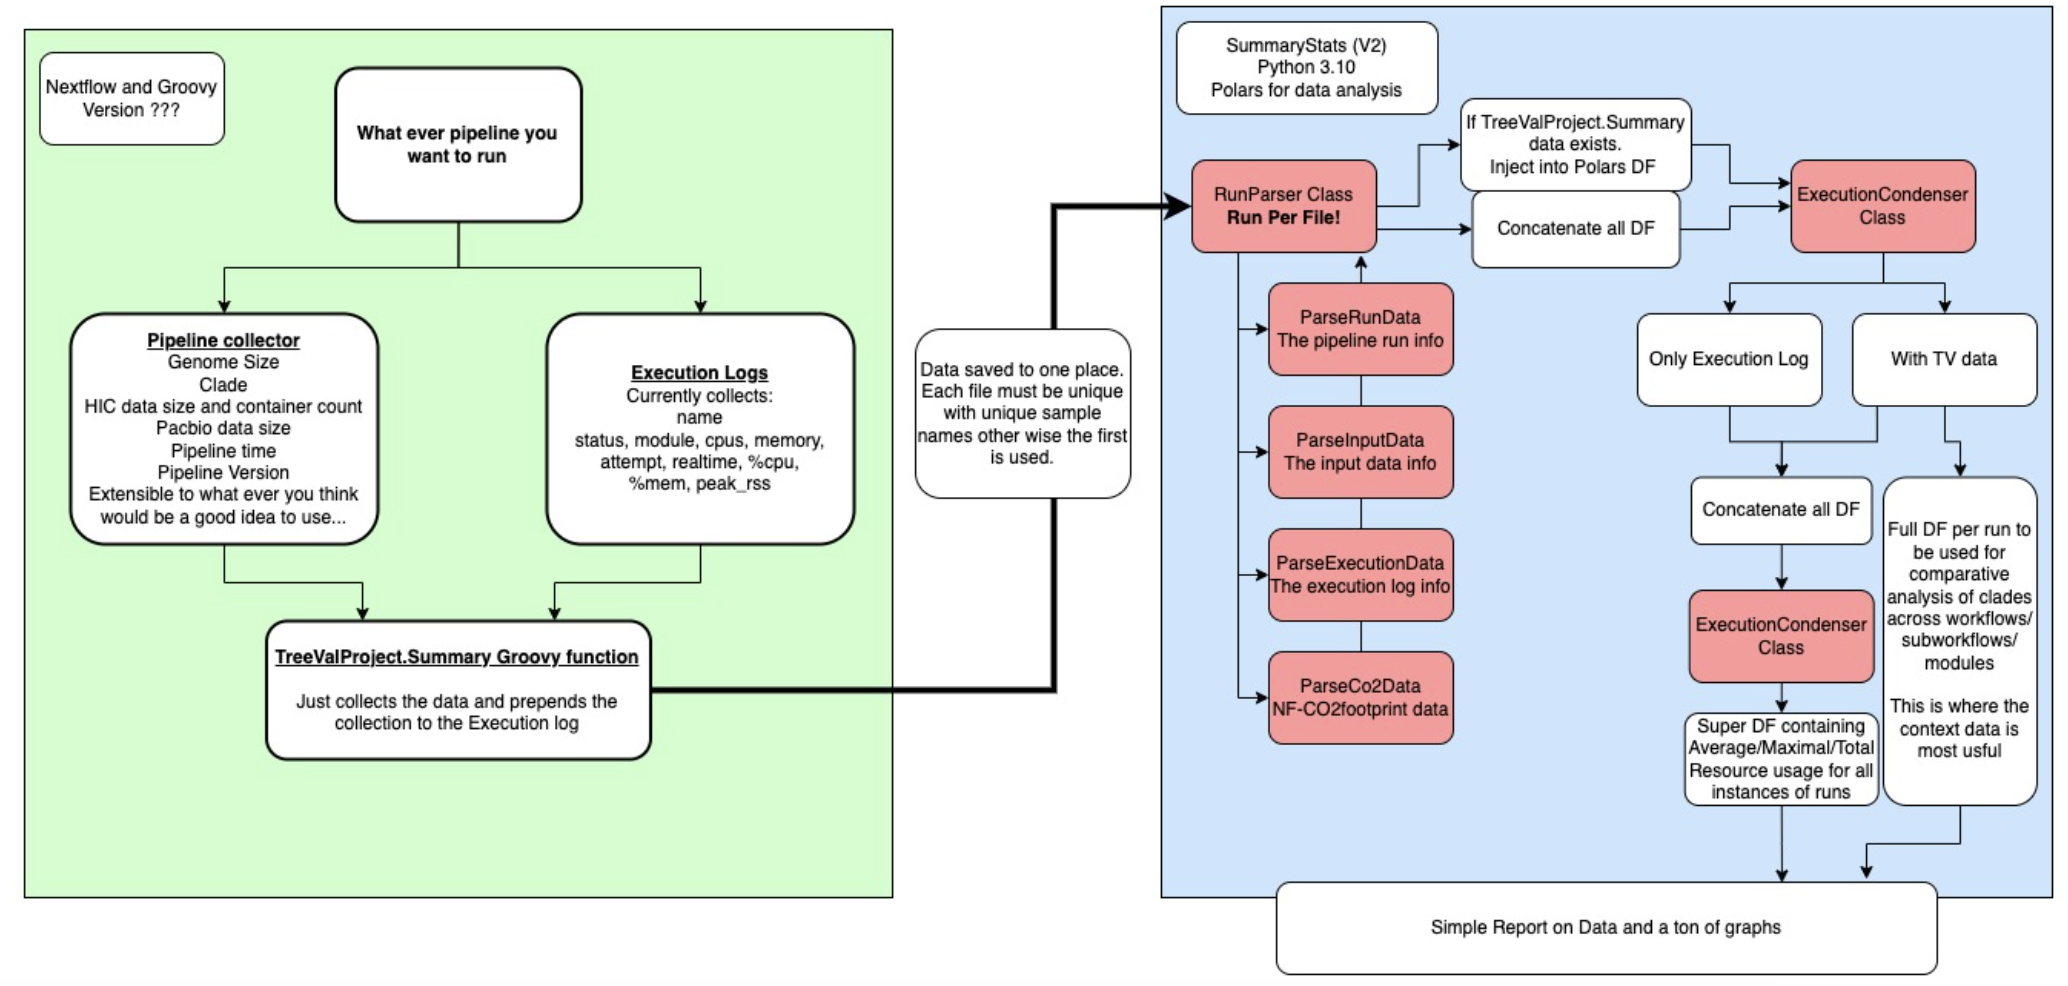 Figure 1: The SummaryStats workflow. Green is the Nextflow controlled pipeline execution, blue is SummaryStats, red are the classes built to parse the data.
1 - The execution log
First, we have the pipeline. This is any pipeline which generates an execution.log file containing the following data:
name status module cpus memory attempt realtime %cpu %mem peak_rss
Note - this should be made much more generic, being able to take in any execution log as long as it contains these columns
2 - TreeValProject.SummaryStats (Optional)
For TreeVal, with the help of my colleague Matthieu Muffato, I wrote a stats collector which created a large channel containing data channels where the size of the files had been calculated along with some other minor statistics too.
This is then passed into a very simple groovy module called by TreeValProject.SummaryStats. I have been calling this the contextual data, It provides context to the execution log data and allows it be more finely investigated.
The product is this:
---RUN_DATA---
Pipeline_version:   v1.0.0
Pipeline_runname:   adoring_descartes
Pipeline_session:   cca9c515-aead-4422-a9c6-2cc2d442788d
Pipeline_duration:  21024
Pipeline_datastrt:  2023-10-30T10:10:44.749074245Z
Pipeline_datecomp:  2023-10-30T16:01:08.773408982Z
Pipeline_entrypnt:  RAPID
---INPUT_DATA---
InputSampleID:      icTacRufp1_1
InputYamlFile:      /lustre/scratch123/tol/resources/treeval/treeval_yaml/icTacRufp1_1.yaml
InputAssemblyData:  [[id:icTacRufp1_1, sz:1180420165, ln:insects, tk:DTOL], /lustre/scratch124/tol/projects/darwin/data/insects/Tachinus_rufipes/assembly/draft/treeval/icTacRufp1_1/data/ref.fa]
Input_PacBio_Files: [[id:pacbio, sz:10401817280], /lustre/scratch124/tol/projects/darwin/data/insects/Tachinus_rufipes/assembly/draft/treeval/icTacRufp1_1/working/work/a0/7902b6c26ff188884d3ba3e1bc573d/in/m84093_231011_151832_s1.ccs.bc2009.filtered.fasta.gz]
Input_Cram_Files:   [[id:cram, sz:28028271117, cn:3], /lustre/scratch124/tol/projects/darwin/data/insects/Tachinus_rufipes/assembly/draft/treeval/icTacRufp1_1/working/work/b1/3c4ea6c746b8cee19865af7d9b23ff/in/47799_2#2.cram]
---RESOURCES---
We have the pipeline run information which includes the version of the pipeline (and should probably contain the name of the pipeline too really), the unique run and session names, the duration in seconds, the time stamp for start and finish as well as the entrypoint used. TreeValfor instance relies on 3 major entry points, each of which are subsets of each other. This is for good reason as some assemblies simply do not need all the analysis performed by the FULL pipeline.
Next, we have the INPUT_DATA, what I call contextual data. Information on the Input sample name, the yaml used, the assembly fasta file (size, clade and ticket project), the pacbio data (size per file), HIC files (size per file, number of container chunks per file see Cram containers). I’m sure there maybe more stats we could collect on these files alone, however, these are a good starting point.
Resources then eludes to the fact I append the execution log data to the file
3 - SummaryStats (Python 3.10)
Key dependencies:
As long as you have a directory per pipeline logs which are homogenous (if only a few logs have contextual data then it will default to not using them at all, there’s simply not enough data) then the script can get to work.
The data will be parsed and converted into a Polars dataframe. I have used Polars after a suggestion from a colleague, James Gilbert, and it works really well other than a few incompatibles which are easy enough to get around. Polars is rust-based and simply more powerful than Pandas (based on a mix of Python, CPython and C), being able to work on bigger data at a faster rate. Quite literally, this halved the processing speed of the script.
There is a parser for:
- Run data
- Input data
- Execution data
- Co2 data
The last one is something i’d like to flesh out significantly. A researcher by the name of Sabrina Krakau wrote a NF-CO2FOOTPRINT plugin for Nextflow and this calculates the co2 footprint of each process using localised power generation data as well as the CPU’s in use in your computer/cluster. Very cool and can be used to target high usage high footprint processes.
4 - Condenser
Depending on whether all files have the contextual data, it will move through 1 or two rounds of condensing.
Context Condensing
The only occurs on data with context data and the goal is condense the individual runs of the pipeline. This ensures that, when we bind the data together, we are retaining the contextual per run. This means we can graph this data and generate graphs which separate out Clade, Genome Size, Assembly Data Size, and Entry point of the pipeline.
Pipeline Condensing
Second round condensing occurs on the Contextual data and effectively strips it from the DataFrame, returning generalised graphs covering the memory and cpu usage across the pipeline. This is the only round of condensing that occurs on non-contextualised data (execution logs from non-TreeValProject.summary enhanced pipelines).